I bought my 2014 i3 two years ago and I have been tracking various metrics that seemed relevant to battery capacity/ state of health since then.
Because this seems to be a hot topic on here and because I like charts and graphs, I wanted to share some of what I have found.
First, some disclaimers:
1) This data was manually tracked by me so it may have typos/errors in it but I think I was pretty diligent in entering the data correctly.
2)Because this was manually pulled from the service menu on the car, I only logged data points when I felt like it. There is a high likelihood that this introduces some skew because it's nowhere close to a random sample.
3) This is based on ONE vehicle/battery. It's possible different 2014 i3 batteries behave differently.
4) Some metrics have more data points than others. For example, I only log trip kWh on trips where I left from 100% charge and remembered to reset the trip meter.
5) Since I bought the car used I only know some of its history. It seems to have started its life in California and the owner I bought it from had it for about a year in the midwest.
With that out of the way, the big questions are "what is the state of my battery?" and "how fast is it degrading?" With the i3, there are a few ways to estimate this and none of them are exact. In keeping with the spirit of "all models are wrong, but some are useful", here are the metrics that I have found useful to track in order to answer this question:
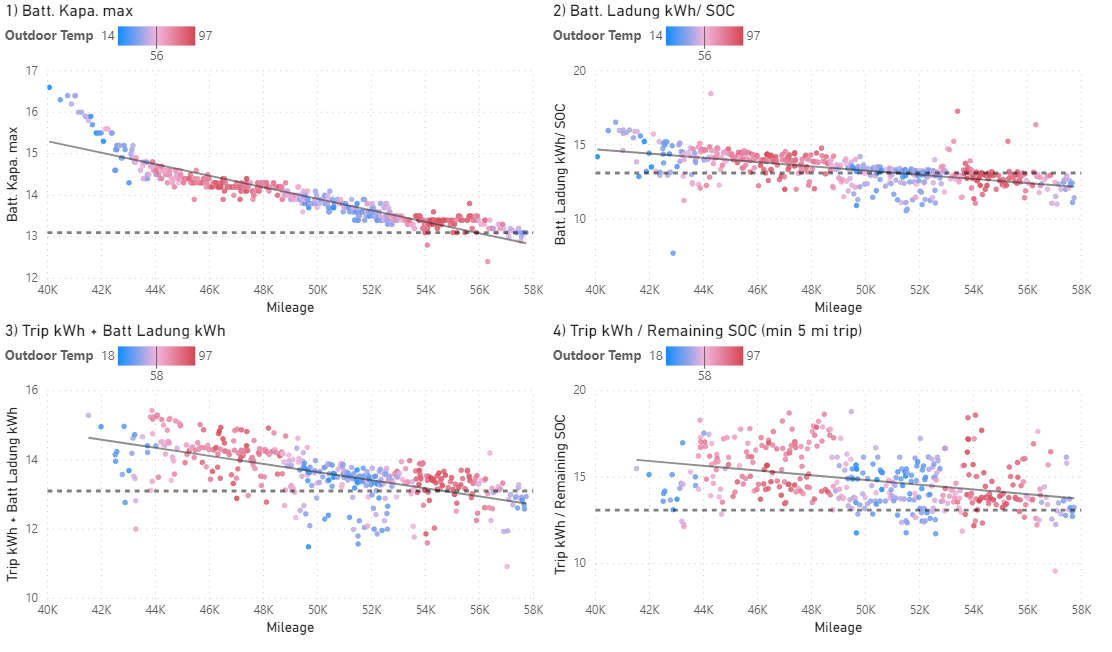
1) Batt. Kapa. Max. This one can be accessed through the service menu and taken from the car as-is.
2) Batt. Ladung kWh/ SOC. The service menu shows Batt Ladung (charge) in percent and kWh. By taking kWh divided by % we can get what the car thinks is the 100% kWh level.
3) Trip kWh + Batt Ladung kWh. The Batt Ladung kWh still comes from the service menu, and to get Trip kWh you reset the trip computer and at the end of your trip take your Trip Miles and divide by Trip Efficiency in mi/kWh.
4) Trip kWh / Remaining SOC. This is the same trip kWh calculation from #3 divided by the same % from #2.
Charting these over the course of my almost-20k mile ownership of my car yields these charts. I've added a trend line and a dashed line to represent 13.1kWh and color coded the dots by outdoor temperature because that seems to be relevant:

Some observations I've noticed from this:
1) Batt Kapa Max seems to have the fewest outliers and most consistently represent battery capacity, though it definitely has variation as well.
2) Degradation seems to be non-linear and possibly accelerates in cold weather. Additionally, these trendlines all suggest a value at 0 miles well above the 18.8 kWh intercept they "should" have.
3) These metrics often disagree with each other on capacity for any given reading but plotted together they seem to agree on a downward trend and a very approximate capacity.
4) My car seems to be very close to the 70% threshold specified in the warranty. The next few months could be a good indication of whether BMW included any sort of "battery buffer" that is automatically released to keep the capacity at/ above 70%.
Anyway, hopefully this is useful or interesting to some folks. If you have any questions or comments let me know. I have some other charts I find somewhat interesting that I'll try to share but if there's any correlation someone has been wondering about, feel free to ask and I can see if I have the data to look at it.
Because this seems to be a hot topic on here and because I like charts and graphs, I wanted to share some of what I have found.
First, some disclaimers:
1) This data was manually tracked by me so it may have typos/errors in it but I think I was pretty diligent in entering the data correctly.
2)Because this was manually pulled from the service menu on the car, I only logged data points when I felt like it. There is a high likelihood that this introduces some skew because it's nowhere close to a random sample.
3) This is based on ONE vehicle/battery. It's possible different 2014 i3 batteries behave differently.
4) Some metrics have more data points than others. For example, I only log trip kWh on trips where I left from 100% charge and remembered to reset the trip meter.
5) Since I bought the car used I only know some of its history. It seems to have started its life in California and the owner I bought it from had it for about a year in the midwest.
With that out of the way, the big questions are "what is the state of my battery?" and "how fast is it degrading?" With the i3, there are a few ways to estimate this and none of them are exact. In keeping with the spirit of "all models are wrong, but some are useful", here are the metrics that I have found useful to track in order to answer this question:
1) Batt. Kapa. Max. This one can be accessed through the service menu and taken from the car as-is.
2) Batt. Ladung kWh/ SOC. The service menu shows Batt Ladung (charge) in percent and kWh. By taking kWh divided by % we can get what the car thinks is the 100% kWh level.
3) Trip kWh + Batt Ladung kWh. The Batt Ladung kWh still comes from the service menu, and to get Trip kWh you reset the trip computer and at the end of your trip take your Trip Miles and divide by Trip Efficiency in mi/kWh.
4) Trip kWh / Remaining SOC. This is the same trip kWh calculation from #3 divided by the same % from #2.
Charting these over the course of my almost-20k mile ownership of my car yields these charts. I've added a trend line and a dashed line to represent 13.1kWh and color coded the dots by outdoor temperature because that seems to be relevant:
Some observations I've noticed from this:
1) Batt Kapa Max seems to have the fewest outliers and most consistently represent battery capacity, though it definitely has variation as well.
2) Degradation seems to be non-linear and possibly accelerates in cold weather. Additionally, these trendlines all suggest a value at 0 miles well above the 18.8 kWh intercept they "should" have.
3) These metrics often disagree with each other on capacity for any given reading but plotted together they seem to agree on a downward trend and a very approximate capacity.
4) My car seems to be very close to the 70% threshold specified in the warranty. The next few months could be a good indication of whether BMW included any sort of "battery buffer" that is automatically released to keep the capacity at/ above 70%.
Anyway, hopefully this is useful or interesting to some folks. If you have any questions or comments let me know. I have some other charts I find somewhat interesting that I'll try to share but if there's any correlation someone has been wondering about, feel free to ask and I can see if I have the data to look at it.


![300W Car Power Inverter DC12V to AC110V,Dc to AC Car Plug Adapter Outlet with Multi USB[24W USB-C] /USB-Fast Charger(24W) Car Inverter,Car Charger for Laptop Vehicles Road Trip PiSFAU](https://m.media-amazon.com/images/I/41-KedJShYL._SL500_.jpg)


